


Morning technical analysis – 17 March 2014 | Alpari Newsroom …

Morning technical analysis – 17 March 2014
March 17, 2014
by
in
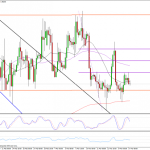
EURUSD
While it may have lost some momentum recently, the euro is still looking bullish against the dollar. That said, we are getting warning signals that the trend may be about to change. For example, as you can see on the 4-hour chart below, we failed to make a new high on Friday. If the pair now trades below 1.3845, thereby making a new low, we would by definition have entered into a new downtrend. A close below this level would also mean the neckline of the head and shoulders, again on the 4-hour chart, has been broken. Based on the size of the formation, this would suggest a conservative target of 1.3755, shoulder to neckline repeated below, and a more aggressive target of 1.3730, head to neckline repeated below. It is worth noting though that even if a head and shoulders forms, it doesn’t mean the neckline will be broken. In fact, quite often, the neckline will act as support, prompting a rally higher. We’ve also already seen the 61.8 fib level, Thursday lows to Friday highs, act as strong support which suggests the head and shoulders may not even be completed. If this is the case, I will want confirmation of the uptrend continuation, given that we basically traded sideways for almost two weeks. This would initially come from Friday’s highs being broken, with further confirmation coming from the break above 13 March highs.
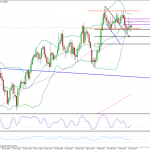
GBPUSD
This is another pair that has been stuck in a sideways trend over the last couple of weeks, but as far as I’m concerned, it still looks bullish. A double top formed over the last couple of weeks but the pair failed to close below the neckline despite numerous attempts. This, at least for now, is a bullish signal in my opinion. Of course that doesn’t mean we won’t get another attempt to break below, but for now at least, the bulls are not allowing a break below the neckline. If this is broken, then it would start to look a lot more bullish and, based on the size of the double top, could prompt a move towards 1.6440. Another bullish signal came when the pair retested the top of the descending trend line that it previously broke above. This acted as confirmation of the break and is ordinarily very bullish. For now, the pair is showing no sign of breaking out of this sideways trend. A break below the neckline would indicate that it’s over, as would a break above 7 March highs.
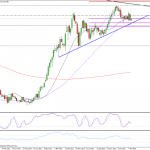
USDJPY
This is yet another pair that is really lacking direction at the moment. The safe haven status of the yen has really benefited the currency in recent weeks and I think this is the only reason we haven’t seen the pair move higher following the pull back to 100.60. The pair was looking bullish and I therefore expect the uptrend to resume, just potentially not as soon as initially thought. For now, the sideways trend looks like continuing. In the short term, the pair is looking bullish, especially if it manages to close above Friday’s open, forming a bullish engulfing pattern. However, as we’ve seen recently, it may not last very long before the pair runs into resistance. This could be found around 102.67, which has been a key level of resistance for the pair during this sideways trend. Above here we have 7 March highs, of 103.75.
Author: Craig Erlam
Tagged EUR/USD, Fibonacci, Fibonacci Expansion, Fibonacci Retracement, foreign exchange trading, forex, forex uk, FX, GBP/USD, Metatrader 4, Moving Averages, MT4, MT5, Resistance, Support, Technical analysis, Trend line, USD/JPY
From –
Morning technical analysis – 17 March 2014 | Alpari Newsroom …
See which stocks are being affected by Social Media

