


Morning technical analysis – 29 January 2014 | Alpari Newsroom …

Morning technical analysis – 29 January 2014
January 29, 2014
by
in
EURUSD
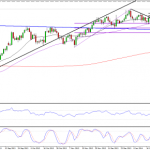
Yesterday’s rebound off the neckline of the double bottom has made the eurodollar pair look a lot more bullish in the short term, despite the initial failure to close above the 50 fib level, around 1.37. Based on the size of the double bottom, we should now see a move towards 1.3790. Obviously as with all these formations, this is just a rough target but as it roughly coincides with both a previous level of resistance and the 76.4 fib level, it does add a little more comfort. Ordinarily I’m not a big fan of this fib level, or the 76.8 which is the alternative around this level, but as it fits so well on this occasion and falls on a round number, 1.38, it’s probably worth paying attention to. One potential concern is the lack of upward drive following the retest of the double top neckline. However, as you can see on the 4-hour chart below, this could just be consolidation in the form of a descending wedge, which is a bullish continuation pattern. Now that we appear to have see a breakout above the formation, the pair could gather some upward momentum. A break above 1.3687, previous high, would back this up, with further targets then being 1.3716 and 1.3739.
GBPUSD
Sterling is continuing to look bullish against the dollar, after finding significant support around the 50 fib level on Friday before gapping higher at the start of the week. Yesterday’s spinning top candle may have hinted at a bearish reversal today, however the early retracement was short-lived and the pair didn’t even come close to taking out yesterday’s lows. Instead it has continued to rally and looks likely to take out yesterday’s highs which would make any reversal very unlikely in the short-term. Once these highs are taken out, the next target will be 1.6667 followed by 1.6745, 28 April 211 high. If we do see a move to the downside, the first target will be yesterday”s lows, around 1.6535, followed by this week’s lows of 1.6473.
USDJPY
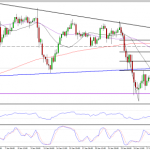
The dollar is actually looking a little bearish against the yen, despite trading higher for a third consecutive day. The pair ran into a number of resistance levels over the last couple of days, initially failing to hold above 103.30, where the 50-day SMA intersects the 50 fib level, before moving back below the ascending trend line, which dates back to 18 December. Another close below here today would leave a very bearish looking candle, although we’ll have to wait until tonight to see exactly what that is. This currently appears to be confirmation of the initial break below the trend line, which could prompt a continuation of the longer term retracement, with the next target being 101.75, previous low, followed by 101.61 and 101, the 50% retracement of the move from 8 October lows to 2 January highs.
Author: Craig Erlam
Tagged EUR/USD, foreign exchange trading, forex, forex uk, FX, GBP/USD, Metatrader 4, MT4, MT5, Technical analysis, USD/JPY
Originally from:
Morning technical analysis – 29 January 2014 | Alpari Newsroom …
See which stocks are being affected by Social Media

