

Morning technical analysis – 5 February 2014 | Alpari Newsroom …
Morning technical analysis – 5 February 2014
February 5, 2014
by
in
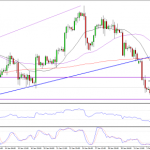
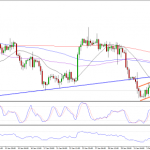
EURUSD
We’re still waiting for the euro to break lower this morning, after it entered a period of consolidation against the dollar. The pair has tested the bottom of the flag formation, a bearish continuation pattern, on a few occasions but has so far only managed to trade briefly below it before closing back inside. I’m seeing no indication, as yet, that the pair will not break below it, it still looks to be more a case of when. The daily chart also supports this bearish outlook, with the pair having broken below both the ascending trend line and the 61.8 fib level, from the 7 November lows to 27 December highs, before finding resistance around this level over the last couple of days. Below the flag, the pair should find support around 1.3458, 38.2% retracement of the move from 9 July lows to 27 December highs, 1.34, previous support, 1.3376, 200-day SMA, and 1.3323, 50% retracement of the above move and a previous level of support.
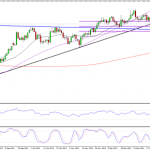
GBPUSD
Sterling is looking a little more bullish against the dollar today, having found strong support yesterday around 1.6260, 50% retracement of the move from 12 November lows to 24 January highs and a previous level of support and resistance. The pair recovered its earlier losses following this bounce to end the day higher, but the resulting candle isn’t quite as bullish as it could have been. If we see a close above the marubozu line of Monday’s candle, today, resulting in a morning star formation, that would give me a lot more confidence in the bullish reversal. As it stands, all we have is an warning that this may be happening. I would be happier again if the pair breaks back above the ascending trend line, but as we’ve seen in the past, this isn’t essential. The 4-hour chart doesn’t exactly give us much more conclusive information. The pair appears to be consolidating just above the fib level, but with it making higher highs, while finding resistance around 1.6340, this could be viewed as an ascending triangle, which is bullish. However we’ll have to wait for a couple more candles to support this. If we see a break above this resistance though, it would certainly support the idea that we’ve seen a bullish reversal.
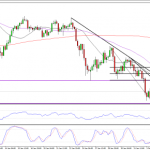
USDJPY
The dollar is showing further weakness against the yen, despite the pair showing signs of bullishness at the start of the week. The pair appeared to find support around 100.60, the 50% retracement of the move from 8 August lows to 2 January highs but this is now only looking like a temporary pause during the larger correction. As you can see on the 4-hour chart, the pair is continuing to be sold at key fib levels, previous supports and around descending trend lines. The formation of an evening star around 101.77, where the pair faces very strong resistance, was a clear indication that the sell-off in the pair is not over yet. The next obvious target is 100.75, previous low, followed by 100.60, 50 fib level, and 100, 200-day SMA. The 200-day SMA has been a key level of support over the last year or so and I would be very surprised if history doesn’t repeat itself here. A failure to break below this would confirm that traders remain bullish and could therefore prompt the start of the next bullish phase.
Author: Craig Erlam
Tagged EUR/USD, foreign exchange trading, forex, forex uk, FX, GBP/USD, Metatrader 4, MT4, MT5, Technical analysis, USD/JPY
View original post here:
Morning technical analysis – 5 February 2014 | Alpari Newsroom …
See which stocks are being affected by Social Media

