
Morning technical analysis – 6 March 2014 | Alpari Newsroom | Live …
Morning technical analysis – 6 March 2014
March 6, 2014
by
in
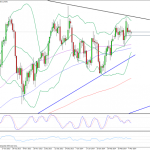
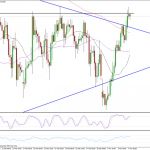
EURUSD
The euro is continuing to look a little weak against the dollar, although we haven’t yet had confirmation that the trend has turned more bearish. The pair found support yesterday from a number of indicators, the middle bollinger on the daily chart, the 100-period SMA on the 4-hour chart, the 61.8 fib level, the move from 27 February lows to 28 February highs, and the 61.8 fib expansion, of the move from 28 February highs to 4 March lows. Clearly this is a very key level and a break of this would be the initial bearish confirmation that we need. With the pair having found initial support from the 61.8 Fibonacci expansion level, the pair could now target the 100 fib expansion, around 1.3668. Further support could be found just below here as well from the 50-day SMA and the 200-period SMA on the 4-hour chart. These have already provided significant support in the last week, or so. Below here, further support should be found around 1.3643, 123.6 fib expansion, 100-day SMA and previous low. If the pair pushes higher, the next target should be Tuesday’s highs of 1.3780, as a break of this would be an early indication that the recent downtrend, from the end of February, has ended.
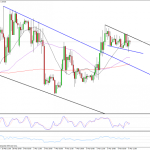
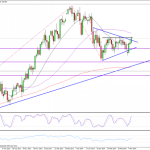
GBPUSD
Sterling is looking very bullish against the dollar at the moment, despite struggling for direction this morning. The pair rallied strongly yesterday after finding support from the top of the flag that is broke above last week. This effectively confirms the initial break and is very bullish. On top of that, the pair formed a morning star after confirming the break, which only makes it look more bullish. It is now starting to make higher highs and lows on the 4-hour chart, which is another good sign of the bullish bias in the market. Right now, the pair is consolidating, resulting in a descending wedge, which in itself is a bullish continuation pattern. If we see a break above here, which I would expect, the next target would be yesterday’s highs of 1.6740, followed by 28 February highs of 1.6768. A break of these would further confirm the continuation of the bullish trend.
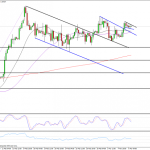
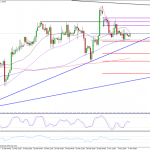
USDJPY
The dollar is heading for a third positive day against the yen, since gapping below the triangle at the start of the week. The response to gapping lower has been very positive and could therefore be construed as quite bullish, especially as it has since broken the the triangle resistance. The triangle could be viewed as either an ascending triangle, which is bullish, or a normal triangle, which is a bearish continuation pattern so it’s worth being very careful. If we manage to see a close above the triangle today it would suggest it is the former and could prompt a continuation of the longer term bullish trend. The pair should then find resistance around 103.08, 50-day SMA, and 103.44, previous high.
N.B. We have two important interest rate decisions today, the Bank of England and the European Central Bank. While nothing is expected from the BoE decision, we could see a change from the ECB which will more than likely have a significant impact on the euro. The ECB press conference also usually creates a lot of volatility in the euro pairs so it’s worth taking this into consideration when carrying out your analysis.
Author: Craig Erlam
Tagged EUR/USD, Fibonacci, Fibonacci Expansion, Fibonacci Retracement, foreign exchange trading, forex, forex uk, FX, GBP/USD, Metatrader 4, Moving Averages, MT4, MT5, Resistance, Support, Trend line, USD/JPY
Link:
Morning technical analysis – 6 March 2014 | Alpari Newsroom | Live …
See which stocks are being affected by Social Media

