


Morning technical analysis – 7 January 2014 | Alpari Newsroom …
Morning technical analysis – 7 January 2014
January 7, 2014
by
in
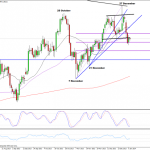
EURUSD
The euro is trading lower against the dollar this morning after failing to close back above the neckline of the double top yesterday. This failure to close back above could be seen as confirmation of the initial break below the neckline, prompting a move back towards 1.3450, based on the size of the double top. This neckline also coincided with the marabuzo line of the previous candle, a failure to break above this is also a sign that the market is bearish. A close above here would have resulted in a piercing pattern which typically indicates a bullish reversal. As you can see on the 4-hour chart, the pair also failed to break back above the 200-period SMA, which again supports the bearish outlook for the pair. If we do see a continuation of the move lower, the pair should find support around 1.3570, 1.3525 and 1.3490.
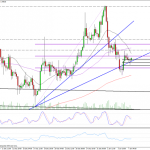
GBPUSD
Despite starting on the back foot this morning, sterling is continuing to look bullish against the dollar. Yesterday we saw a lot of dollar buying that threatened to push the pair below the ascending trend line and make the pair appear more bearish. However, a close below never materialised. In fact, the pair recovered early in the US session before pulling back late on, resulting in a spinning top. The combination of the spinning top candle and the failure to close below this key level, with both the ascending trend line and the 20-day SMA providing support, clearly suggests the bias in the market is still bullish. It’s also interesting to see that the two recent spinning tops on the 4-hour chart and the one of the daily are accompanied by high trading volumes which suggests a large number of buyers attempted to protect this level. This again is generally seen as a bullish indicator. If we do see a push higher, resistance should be found around 1.6432, 1.6473 and 1.66.
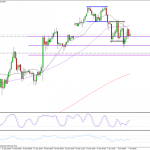
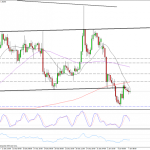
USDJPY
The dollar is looking a little weaker against the yen, having closed below the ascending trend line, which dates back to 7 November, yesterday. The pair did find strong support just below here though, where the 20-day SMA intersects the 50 fib level, of the move from 17 December lows to 2 January highs. However, it’s not clear at this stage whether this is retracement as part of the move higher or just a temporary support following a trend reversal. At this stage, it’s looking like the latter may be true for a few reasons. Firstly, the reaction at the 50 fib level was not as aggressive as I’d expect if this was merely a retracement. Secondly, the trend line is providing resistance for the pair so far today which could be seen as confirmation of the break below, a bearish indicator. The 4-hour chart also looks bearish, with the 20-period SMA providing resistance for the pair since it broke below it last week. The pair also failed to break back above the neckline of both the double top, which is broke below previously, and the newly formed double bottom. All things considered, I think we could see further downside moves in the coming days and weeks, although I’ll need to see a break below the 20-day SMA to confirm this bearish outlook. If we do, this would suggest that last week’s hanging man on the weekly chart was in fact an early indication that the uptrend has temporarily ended.
Author: Craig Erlam
Tagged EUR/USD, foreign exchange trading, forex, forex uk, FX, GBP/USD, Metatrader 4, MT4, MT5, Technical analysis, USD/JPY
View the original here:
Morning technical analysis – 7 January 2014 | Alpari Newsroom …
See which stocks are being affected by Social Media

