
The Last Two Times This Happened, Stocks Crashed | Zero Hedge
Are stocks disconnected from reality? Probably, according to Tobin’s Q, a rather elegant way to assess equity valuations developed by the late Nobel Prize-winning Yale economist James Tobin. Put simply, Tobin’s Q compares the total value of stock prices with the value of underlying assets such as plants, inventory, and equipment (i.e. replacement costs). Add up the value of the equity, then buy all the assets, and see if you have some cash left over. If you do, stocks were overvalued.
We’ve looked at this on a number of occasions, most recently in January when we noted that the Q ratio was near peaks observed over most of history’s bull markets, and as Bloomberg reports, stocks are now more overvalued than at any time in history with the exception of the tech bubble and the 1929 highs.
Via Bloomberg:
If you sold every share of every company in the U.S. and used the money to buy up all the factories, machines and inventory, you’d have some cash left over. That, in a nutshell, is the math behind a bear case on equities that says prices have outrun reality.
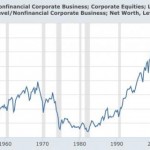
The concept is embodied in a measure known as the Q ratio developed by James Tobin, a Nobel Prize-winning economist at Yale University who died in 2002. According to Tobin’s Q, equities in the U.S. are valued about 10 percent above the cost of replacing their underlying assets — higher than any time other than the Internet bubble and the 1929 peak.
Here’s a look at the chart:
The above should come as absolutely no surprise to regular readers. Indeed, corporate management teams have adopted policies that virtually ensure the value of their equity will far outrun the replacement costs of the underlying assets.
As we’ve documented exhaustively — in fact, one might argue that it’s been the single most important narrative we’ve pushed this year — companies are taking advantage of record low borrowing costs and voracious demand for corporate bonds by issuing record amounts of debt. The problem: the proceeds aren’t going towards capex (i.e. future growth and productivity) but rather towards buybacks which not only inflate EPS but also management’s equity-linked compensation.
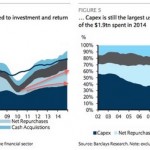
This means that while stocks climb ever higher thanks to a perpetual bid from price insensitive corporate management teams and investors (and central banks) frontrunning the buybacks (repurchase authorizations hit a record in April, so it’s not difficult to see what’s coming), productive assets deteriorate, jeopardizing top line growth and, in turn, the ability to service debt costs down the road. Here are a few graphics that tell the story
One may argue that “capex is higher than ever”, but that is slightly misleading because while it may be at its highest level on record in absolute terms, a look at the following pretty clearly indicates that buybacks have the momentum…
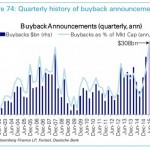
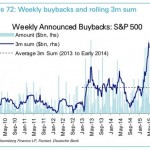
…and buybacks have officially reached escape velocity…
Here’s more from Bloomberg:
The ratio’s doubling since 2009 to 1.10 is a symptom of companies diverting money from their businesses to the stock market, choosing buybacks over capital spending. Six years of zero-percent interest rates have similarly driven investors into riskier things like equities, elevating the paper value of assets over their tangible worth, he said.
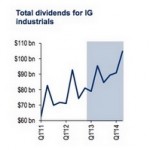
Standard & Poor’s 500 Index members last year spent about 95 percent of their profits on buybacks and dividends, with stock repurchases exceeding $2 trillion since 2009, data compiled by S&P Dow Jones Indices show.
In the first four months of this year, almost $400 billion of buybacks were announced, with February, March and April ranking as three of the four busiest months ever, according to data compiled by Birinyi Associates Inc.
Spending by companies on plants and equipment is lagging behind. While capital investment also rose to a record in 2014, its growth was 11 percent over the last two years, versus 45 percent in buybacks, data compiled by Barclays Plc show.
With equity prices surging and investment growth failing to keep pace, the Q ratio has risen to 58 percent above its average of 0.70 since 1900, according to data compiled by Birinyi and the Federal Reserve on market and asset values for non-financial companies. Readings above 1 are considered by some to be too high and the ratio has exceeded that threshold only 12 percent of the time, mostly between 1995 to 2001.
So congratulations to the Fed and to corporate America. Thanks to a protracted period of ultra-low rates and a combination of corporate short-sightedness and greed, stock prices have been driven to their third-largest disconnect with underlying productive assets in history.
Average:
4.9
Your rating: None Average: 4.9 (10 votes)
Continue reading:
The Last Two Times This Happened, Stocks Crashed | Zero Hedge

