
Tools of the 'Trade' – How I Invest (2014 Edition) — MrSwing
The new year has arrived and with it comes another edition of Tools of the Trade. This is the fourth installment (see 2013, 2012, 2011).
2013 was quite a year. We published the StockBrokers.com 2013 Broker Review in February (2014 due out this February). Then in May my 1st authored interactive book, The Interactive Guide to Technical Analysis, was published. Shortly thereafter, my daughter was born in June, and last but not least we launched the first version (now on v1.5) of our STTG Trade Tools suite just before the New Year.
Oh, and ironically enough today we hit 1,000 fans on Facebook.
Fun times.
Trading Results
When it comes to the market, the number of trades I am able to make each year is dependent solely on the free time I have available.
After the StockBrokers.com Review was published in February, I had some free time and got back into the market. During the summer I was pretty active until the Fall when things slowed back down as work become more busy.
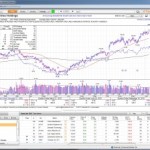
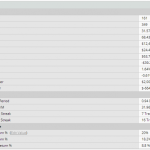
Overall, I ended up with 510 completed trades for the year. You can see my full year end stats below which I pulled from the new STTG Trade Analyzer tool.
It is important to note that I only trade as a hobby. I am not a professional. I have been extremely passionate about the market since I lost half my life savings (several $thousand) in the dot com crash at age 15.
Since I trade as a hobby, I purposely keep my position sizes small and my capital at risk each trade well below the recommended average of 1%.
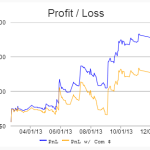
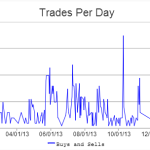
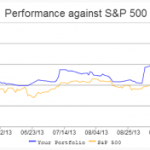
Back to more stats, these quick charts show my P&L over time as well as my activity level and performance against the market. The ability to scan through my past trades and have instant results is one of my favorite parts of the Results Analyzer tool.
If there are a few key takeaways I have from the past year, focusing on those “a ha” moments, they would be:
- The majority of trades are a waste of time. Big winners make the difference and can really propel outperformance.
- Cutting losses short is critical to success. Despite winning on only 31% of my trades, I was still able to post a profit for the year (see my guide to Profit vs Loss Ratios).
- Discipline is everything. Discipline helped me stay calm and lock in my largest winner of the year as well as realize my largest loser of the year. Simply put, emotional trading will wipe you out long term (see 50 Telltale Signs of an Emotional Investor).
In 2014 my main goal is to focus on honing my strategies further. I also want to further improve my ability to scale into positions as well as create more win/win scenarios so winners don’t slip away from me. Needless to say, it should be an interesting year of learning.
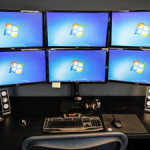
Computer Setup
Back in October 2012 I worked with iBuyPower to build the ultimate budget trading computer. Every time I see one of the trading computer sites advertising $2,000 – $3,000+ rigs I want to vomit. It’s absurd and unnecessary for the average investor.
Together with iBuyPower we built a $1,200 machine that easily keeps up with the $2,000+ rigs advertised across the web.
(The specs you will see below are for a three monitor setup. Earlier this year I added antoher graphics card and upgraded to six monitors.)
PC Specs – Three ASUS 24″ LED Monitors running off iBuyPower Professional Series P300 rig with an Intel Core i7-3770 Processor (Today I’d go with a Haswell 4th gen Intel Core i7), 8 GB high performance gaming memory, 1 AMD Radeon HD 7770 video card, and a 120 GB ADATA S510 SSD Hard Drive.
Online Brokers
Because of StockBrokers.com testing I have money spread across a dozen+ brokers. While there are a lot of great online brokers out there, finding the right one depends on your specific needs as an investor.
If you are looking for a new broker or are considered a switch, I welcome you to read my online broker guide here on the site, or better yet use the best broker lists on StockBrokers.com.
Investment Sites, Services & Subscriptions
I use a variety of different services to help me research and monitor the market.
The below services & subscriptions are a part of my daily routine. It should be noted that some of these services are provided for me at no cost since we occasionally use the research in our daily market recaps.
StockTradingToGo – Free and Paid – Inspired by my new found passion for post trade analysis alongside a goal to bring my personal excel trade log to the web, the StockTradingToGo Investors Tools were born. Currently we have four tools: Trade Log, Results Analyzer, Trade Journal, and the new community Trade Feed for sharing trades.ChartPattern.com – $99 per month – ChartPattern.com is home to Dan Zanger (Read my full Dan Zanger review) who is the world record holder for the largest portfolio return in one year. His claim to fame is turning $11,000 into $42 million during the late 90s. Dan sends out a nightly newsletter several times a week with technical analysis and personal notes. He also has a chat room for subscribers. Overall if you enjoy our easy to read charts, you’ll really like Dan’s newsletter.Investors.com – $259 per year – I am a big Will O’Neil fan. I use Investors.com, MarketSmith, and my favorite stock book of all time is How to Make Money in Stocks. As far as Investors.com goes though, I like tracking the IBD 50 and if time permits I enjoy reading the featured articles of the day alongside browsing through the latest issue of Investors Business Daily (IBD) web edition.MarketSmith – MarketSmith ($999 per year) + Pattern Recognition add on ($14.95 p/m) – MarketSmith is a browser based charting software provider powered by Investors.com CANSLIM data. Besides the easy to read charts, the real value driver are the IBD metrics that display with each chart.
MarketSmith ScreenshotSentimenTrader – $25 per month – Through SentimenTrader.com, Jason provides daily market sentiment reports which are a good way to start any morning. He analyzes every trade indicator known to man, including seasonal trends and over 80 years of historical data, to produce a daily report on the market.StockCharts.com – Basic package $14.95 p/m – StockCharts.com is the site we use to produce all the stock charts for the nightly market recaps here on StockTradingToGo. The primary reason we have the basic package is so we can have access to more than three years of chart data and save chart layouts. The free version is the exact same as any paid package less a handful of features.TradingView.com – Free and paid – TradingView is another web based charting software that I just recently got turned on to. What I like is the flexibility of the charts since they are HTML5 driven and the overall ease of use. I disable the community ideas to clear the clutter and stick to clean charts (see also my post on the best free stock chart websites).FINVIZ Stock Screener – Free – FINVIZ’s Stock Screener is the best stock screener available on the web. Once you get the hang of using it, you will bookmark it and wonder how you ever lived without it.Benzinga Pro – Packages start at $39 per month – Benzinga Pro is an ultra cheap alternative to ponying up several thousand per month for a Bloomberg terminal. For breaking market news, the service typically beats most news outlets by seconds or minutes. Brokers like TD Ameritrade offer it free for clients through the thinkorswim platform.
Screening & Watch List
The majority of stocks that make it to my watch list are discovered within blog posts or on websites like investors.com. If I am screening, it is done with FINVIZ or through the MarketSmith screener (great because you can include IBD ratings criteria).
Overall my watch list total on MarketSmith fluctuates. Currently, there are 561 securities on my main list.
Investment Philosophy
While I did daytrade A LOT in 2013 (post on that experience coming soon), my core philosophy has not altered much from last year’s post, so I am repeating, mostly verbatim, my comments from then.
I am a CANSLIM investor at heart and have learned to respect both fundamental and technical analysis. I rely on my own passion for technical analysis to drive my trading and leave the fundamental research to the Will O’Neil (IBD) team.
2013 was a fantastic year for the market so CANSLIM investors on the whole did well. This is not always the case though as we all know so you have to adapt to the market. Shorter term momentum swings and even cash can be used to navigate rough waters.
Success with CANSLIM revolves around going long when the market is moving up and buying the absolute best stocks (fundamentally and technically), adding to positions as they prove themselves correct. Buys come off breakouts from chart patterns like the Cup & Handle.
When I am investing, I always use stop losses and typically shoot for a profit to loss ratio of 1:3. This means I can be wrong three times in a row, have one winner, and still be profitable.
Closing Thoughts
I see investing as a life long game. Every trade is another lesson to be learned and even though I have over a decade of “experience”, I am still learning from each and every one.
So that’s that. Please feel free to share your thoughts in the comments below or email me. I’d love to hear from you. Stay frosty (sharp) out there and I hope 2014 brings all of your portfolios great success.
Original post: Tools of the ‘Trade’ – How I Invest (2014 Edition)
Original source:
Tools of the 'Trade' – How I Invest (2014 Edition) — MrSwing
See which stocks are being affected by Social Media

