
USD/CAD Technical Analysis ? Doji Candle Hints at Rebound …
Talking Points:
USD/CAD Technical Strategy: Long at 1.0907
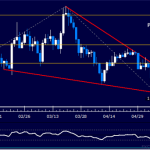
Support: 1.0849 (May 19 low), 1.0832 (trend line), 1.0813 (May 8 low)
Resistance: 1.0973 (14.6% Fib exp.), 1.1072 (23.6% Fib exp.)
The US Dollar broke out upward as expected against its Canadian counterpart after prices completed a bullish Piercing Line candlestick pattern. A Doji candle at trend line resistance-turned-support (now at 1.0832) hints the up move is readying to resume after a brief pullback. The first major layer of resistance is at 1.0973, the 14.6% Fibonacci expansion, with a daily close above that exposing the 23.6% level at 1.1072. Immediate support is at 1.0849, the May 19 low, followed by the falling trend line and the May 8 low at 1.0813.
We bought USDCAD at 1.0907, initially aiming for1.0973. A stop-loss is set to trigger on a daily close below1.0849. We will take profit on half of the position at 1.0973 and trail the stop-loss to the breakeven level.
Excerpt from:
USD/CAD Technical Analysis ? Doji Candle Hints at Rebound …
See which stocks are being affected by Social Media

