Technical Analysis, July 14th — July 18th – Commodity Blog
The technical analysis, that includes the indicators’ data and major pivot points for Brent Oil, Gold, Silver and Copper as traded on spot market as of July 12th, 2014:Indicators
Moving Averages
RSI
Parabolic SAR
CCI
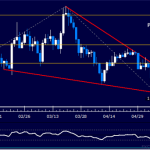
Oil
Short
Neutral
Short
Short
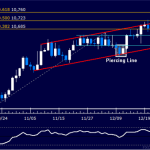
Gold
Long
Overbought
Long
Long
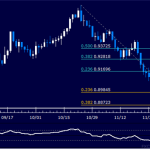
Silver
Long
Overbought
Long
Long
Copper
Long
Overbought
Short
Neutral
Floor Pivot Points
3rd Sup
2nd Sup
1st Sup
Pivot
1st Res
2nd Res
3rd Res
Oil
0.00
0.00
0.00
0.00
0.00
0.00
0.00
Gold
0.00
0.00
0.00
0.00
0.00
0.00
0.00
Silver
0.00
0.00
0.00
0.00
0.00
0.00
0.00
Copper
0.00
0.00
0.00
0.00
0.00
0.00
0.00
Woodie’s Pivot Points
2nd Sup
1st Sup
Pivot
1st Res
2nd Res
Oil
0.00
0.00
0.00
0.00
0.00
Gold
0.00
0.00
0.00
0.00
0.00
Silver
0.00
0.00
0.00
0.00
0.00
Copper
0.00
0.00
0.00
0.00
0.00
Camarilla Pivot Points
4th Sup
3rd Sup
2nd Sup
1st Sup
1st Res
2nd Res
3rd Res
4th Res
Oil
0.00
0.00
0.00
0.00
0.00
0.00
0.00
0.00
Gold
0.00
0.00
0.00
0.00
0.00
0.00
0.00
0.00
Silver
0.00
0.00
0.00
0.00
0.00
0.00
0.00
0.00
Copper
0.00
0.00
0.00
0.00
0.00
0.00
0.00
0.00
Fibonacci Retracement Levels
Oil
Gold
Silver
Copper
100.0%
0.00
0.00
0.00
0.00
61.8%
0.00
0.00
0.00
0.00
50.0%
0.00
0.00
0.00
0.00
38.2%
0.00
0.00
0.00
0.00
23.6%
0.00
0.00
0.00
0.00
0.0%
0.00
0.00
0.00
0.00
If you have any […]