
Weekly Technical Analysis – “Bear Capitulation” 11th June14 …
Swiss holidays yesterday so this week’s technical run through has been delayed slightly.
Price has pushed on from last week’s report and as a consequence some of the technical readings, according to the team are rapidly moving into a contrarian territory which is starting to signal we are moving into the zone of the medium term top in major equity asset markets. On the near term the team expect a very shallow set back before these indexes make their final summer highs ahead of a major correction.
Of course everything in markets is timing. The question I’m struggling with for my own book of asset allocations is whether we will indeed see a shallow set back prior to the final wave here. The technical evidence provides a high level of confidence that should a near term set back occur a final wave higher should, at the least, be attempted and see strong support.
I’ll run through why i have a fairly high conviction the team are correct that we will see a final move higher in a moment. But first, the implications of a final move higher for equities are meaningful for for commodities and commodity currencies, as an out performance allocation. According to the technical asset price history play books we should, theoretically, see this final summer move higher on low breadth and low momentum scoring a narrow negative divergence in abundance. The commodities should be mild out performers on this final wave (as the smart money moves into the asset class in preparation of the herd). Inverse correlation should likely then occur with an even stronger commodity out performance as equities consolidate and fall. We should expect volatility to mask and confuse these large cyclical trends.
The team devote some attention to the medium term issues with these equity markets. The medium term issue devotes some time and attention to cross check which i don’t have time to analyze here today. The issue for most market participants is the here and now and so its worth unpicking this issue first. Aside from the putcall ratio, as the team state, we have no confirmation of a more significant pull back yet. We do have some key indexes on high rsi levels but to short on this basis is not enough. To take some leverage of the table is reasonable but to go short is a high risk trade at present. (Doesn’t mean you can’t take the trade but the target needs to accommodate the high risk vs the stop and the allocation needs to be relatively light. The expectation if running that trade needs to be for a low win/lose ratio. Its simply in the trade design).
Before i lay out the technical detail I’d just to like to remind that my own book has been twice positioned for a major correction in h1. On both occasions I was forced to reverse but the entries were sharp and the exists timely so that, on both occasions i realized a profit for the book. My only point in relaying this history is simply to remind that i have been a bear at various points in H1 guided by data and price not some bias to the market.
With this all said to the near term.
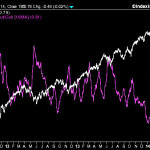
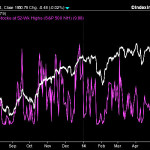
Sp500 stocks making 52 week highs
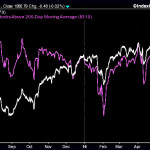
And here sp500 stocks above 200dmas.
And here the sp500 with combined putcall ratio.
Are the three charts confirming a clear market correction here? Simply and slightly annoyingly, no. The technical picture is the best it has looked for some time indeed which sits badly at odds to seasonals and also overdue nature of correction.
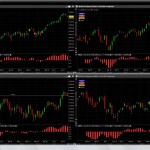
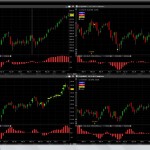
The major four US indexes here with Macd momentum shown.
Sector wise little in the way of momentum divergence here. Speculators are buying these stocks and buying strongly whilst AAII & even the putcall is not yet in absolute contrarian levels. 95% of the time these sort of price and momentum patterns, if on good breadth, will result in a another retest of the highs within a month of elapsed time.
In terms of correlating instruments we can see the US$ is adding weight, usually a bearish US equity index indicator. The dx is through a key level and has momentum as well as recent momentum. We can see that instruments are behaving in an unusual historic manner here from fixed income to the commodities.On the recent performance the commodities have positively correlated to the US$ and fixed income positively correlated with equities. This is extremely unusual. The mean usually reverts but given the technical recent strength in equities the answer may not be as simple as we would hope.
On the near term there are, at best, cross currents of evidence that prevent much of an allocation to the short trade.
The team don’t pick up on the Euro issue, JPY weakness & Aud strength. The euro breakdown appears significant and subject to a meaningful liquidity (QE) move by the ECB its hard to see the event as bullish risk! The euro is not a world wide funding currency, yet and until it is this move is US$ liquidity negative rather than positive, on the medium term.
Without more delay here the Swiss team’s latest comments.
And here Yardeni
And here GS
And here a raft of equity, wealth and commodity reports
As usual more in a few days.
All the best
Rich
(
3
votes, average:
5.00
out of 5)
Loading …
Visit site:
Weekly Technical Analysis – “Bear Capitulation” 11th June14 …
See which stocks are being affected by Social Media

