
Weekly Technical Analysis, Yardeni & CapSyn “The Easy Money …
The Swiss team are travelling this week so its a Yardeni and Capsyn near term track through the usual indicators.
First up I want to present the latest Yardeni reports issued today and over the last few days. They collectively provide a wealth of information on the health and structure of this market.
I include some of the macro and micro data points that are of a longer term nature. On the longer time frame note these charts below with reference to equities as a share of US liquid assets.
Also worth noting the data and chart regarding US payrolls as a share of corporate expenses. From a medium and longer term view the data does not provide a healthy back drop.
Here are the major Yardeni reports and I include a wonderful report from them regarding some of the latest bullion metrics.
Note below the volume data. Its a very low participation rate amongst private investors. Aside from the algo bots the great majority are buy and hold through out this cycle thus far. With M&A as well as stock buy backs a large feature of this market the issuance of new stocks is limited. There is a concentration on the large cap. These cos have access to cheap finance and are buying back their own stock at near record levels. The combination of factors makes for a narrow market in terms of risers and participation. It quite neatly mirrors what is also occurring in terms of participation in all asset markets as well as the ‘recovery’ itself with very few participating in the ‘recovery’. Its a very interesting and worrying phenomena. Unprecedented monetary actions by central banks appear to be resulting in an unprecedented recovery process.
Yardeni-MicroMacroData-14-1-14
& on the gold markets. For long term asset allocation these sorts of metrics are very useful, imo.
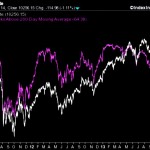
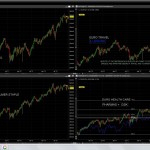
And here below a few charts on the market breadth issues. In terms of 52wk highs there is a better chart pattern. Its not perfect but its better than it was. The larger cap you go the better the breadth.
But there remains plenty of weakness especially in the broader indexes. The NYSE participation in this rally is record breaking market is exceptionally low.
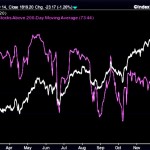
73% of stocks above their 200dma is not too bad in itself inside the sp500. The trend however is not good and if breadth narrow further it appears time will soon be called on this rally.
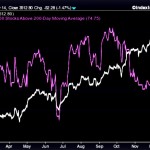
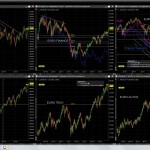
Here the nas100
Again poor trend but an ok level accepting not ideal.
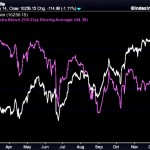
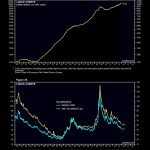
But its when we look at wider indexes like the NYSE with a greater number of smaller cap companies that we see how selective and narrow this market has become.
Remember here we are looking at the number of stocks above their 200dma. 200 days back takes us all the way to May 2013. A huge 36% of stocks have failed to move any higher than their May 2013 price. This is a high number and not what you would expect from a normal recovery process. This recovery has been unusual in the sense that it has always been very weak. We are now into the 6th year of the apparent turn around and yet we have 85% of companies reducing profit expectations yet again and 36% of companies no higher even as the 64% sustain a +27% capital growth. This is unusual therefore. A good question to ask at a macro level is whether the recovery is indeed widening as central bankers tell us or is it narrowing? The nyse 200dma chart tells us the recovery is narrowing and not widening but perhaps this will reverse? It needs to if this bull market is to sustain for much longer.
The overall market put call market index and equity is off her lows recently but remains at contrarian levels and around 1.5 std from her historic mean. She was at 2 a week or so ago.
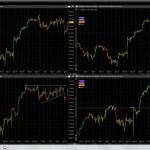
Im struggling to do a sector run through but i put these tracking charts that i use on some of the major euro indexes. The usual suspects are leading the chart once again.
And more here:
and here the major US indexes.
Currencies and fixed income issues i leave to the forum pages and further third party reports.
Yesterday’s move down had momentum. I’m personally on the look out for such step up in momentum as one near term indicator of participants rushing for hedges. Soft data like the AAII Sentiment is at extreme bullishness. Breath remains a concern and the lead sectors are deeply over bought. Earnings forecasts have again come under pressure. Other hard sentiment indicators like the put call ratio indicate that very few participants hold any cover to the downside whilst volume remains low and falling. We are moving into the 6th year of this bull market having recorded a stellar 5th year of capital growth. Its also mid US presidential cycle. Early seasonals remain positive until early May.
All in all, seasonals aside, we have a near perfect scenario for a severe correction. 2013 missed this correction entirely. In my view the easy money has left the table. Now we are left with momentum chasing near term trades as valuations get stretched upwards from late comers to the party. I continue to take cash off the table. Short term trades aside my time horizon for investments has narrowed due to the assumption that we will soon see a broad based correction that will effect all asset classes most likely. An indiscriminate sell off due to the combination of factors as above.
Of course I must add that policy makers can always throw more fuel on the fire to sustain asset price appreciation further. If they do or if the various data points change then of course the allocations and strategy will change with the moves.
All the best
Rich
(
12
votes, average:
5.00
out of 5)
Loading …
Continue reading –
Weekly Technical Analysis, Yardeni & CapSyn “The Easy Money …
See which stocks are being affected by Social Media

