
What Does The VIX Now Say About The Stock Market? | Seeking …
Summary
The VIX is used to measure expectations of market volatility.
It can be used to measure points in time when expectations were high and low.
We are now in period where the VIX is very low. If history is our guide, that can spell trouble.
The CBOE Volatility Index (VIX) is a key measure of market expectations of near-term volatility conveyed by S&P 500 stock index option prices. That is the definition given by the CBOE to describe the level of fear that is in the market.
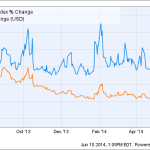
The VIX can be traded by using options, and this is the most pure way of doing it. Large ETFs also are available to trade, and the iPath S&P 500 VIX Short-Term Futures ETN (VXX) should be the most correlated to the actual VIX. It is heavily traded, averaging over 30 million shares per day. As shown below, however, the VXX gets further away from the actual VIX the longer you hold it due to a factor called decay. This is a significant factor in holding the VXX, so proceed with caution if you intend to hold it longer than a short-term trade. Using options with the actual VIX might be preferable.
But the point of this article is to see if we can determine future stock market movements by how the VIX is trading.
Warren Buffett famously said, “Be fearful when others are greedy and greedy when others are fearful”.
If that is true and the VIX measures fear, then we should be looking to buy the market when the VIX is high and sell the market when the VIX is low. That would be true in theory, but has that worked in the past? We will look at the periods when the VIX was low.
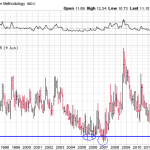
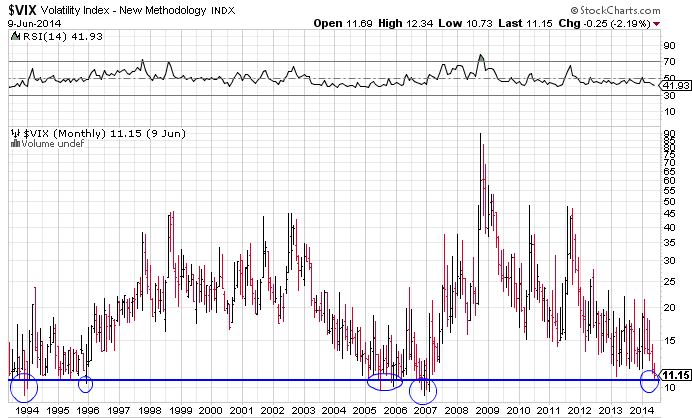
Below is a twenty-one year monthly chart of the volatility index:
Looking at the above chart on a monthly basis, the VIX has traded at 11.15 or lower 5 times, including right now.
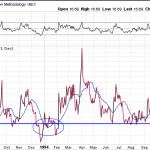
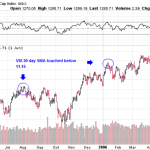
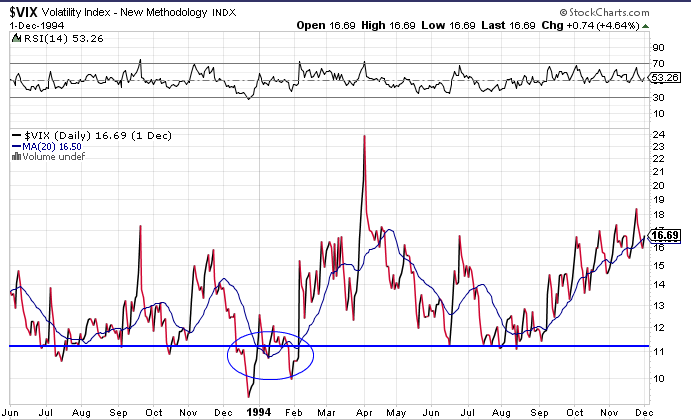
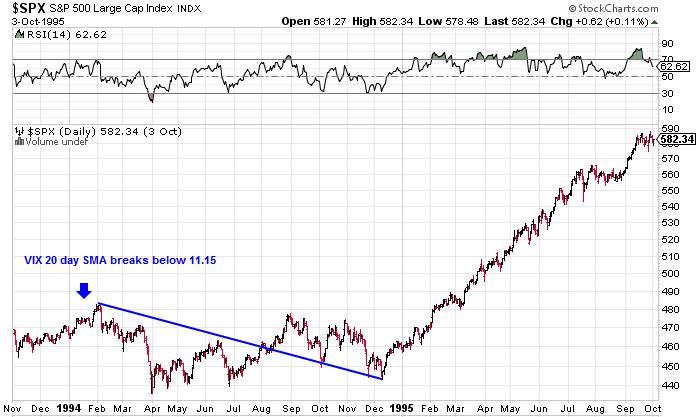
If we zoom into the 1994 period, we see this:
If we overlay a 20-day SMA, we see that the VIX dropped below 11.15 once, in January 1994. Shortly thereafter, the S&P 500 dropped 10%, and was down for about a year following:
1994 is an interesting comparison, as it is a year remembered as a year bond yields rose sharply and bond investors were crushed. It all started when the Alan Greenspan-led Fed raised short-term rates 25 basis points. Yields spiked, the bond market fell, and the stock market did, too. And this all happened shortly after the 20-day SMA VIX moved below 11.15, as investors were not willing to pay up to protect their portfolios.
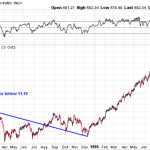
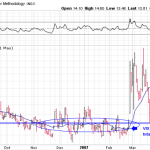
In 1996, the VIX spiked below 11.15, but the 20-day SMA never did:
The 20-day SMA really didn’t get much below 12 in the ’95-’96 time frame. This was an example where buying the VIX could have been a nice trade, but selling the market would not.
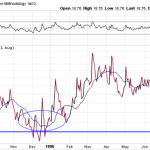
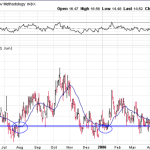
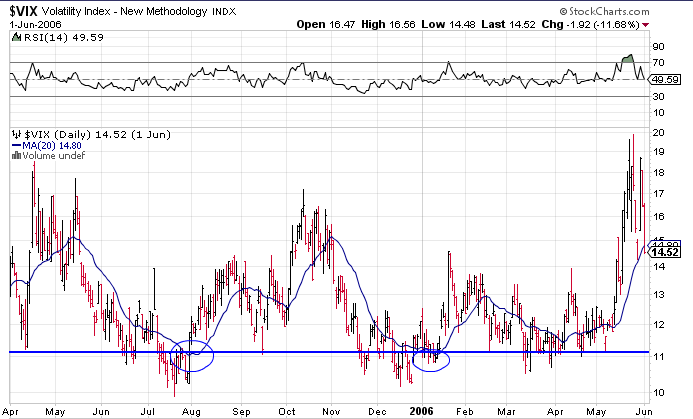
The VIX would not see the 11.15 area again for 10 years, when in 2005, it reached that point again:
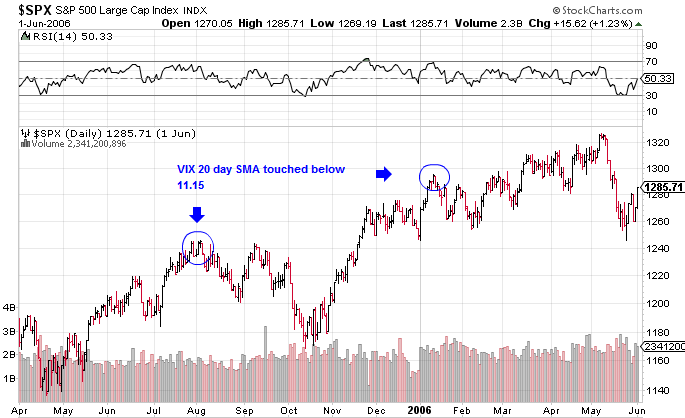
In August 2005 and January 2006, the 20-day SMA briefly touched 11.15, but never got below 11.00. Here is how the market traded after those points:
While both points did result in the market trading lower over a short-term period, the worst peak-to-trough in August 2005 was about a 6.5% decrease.
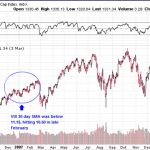
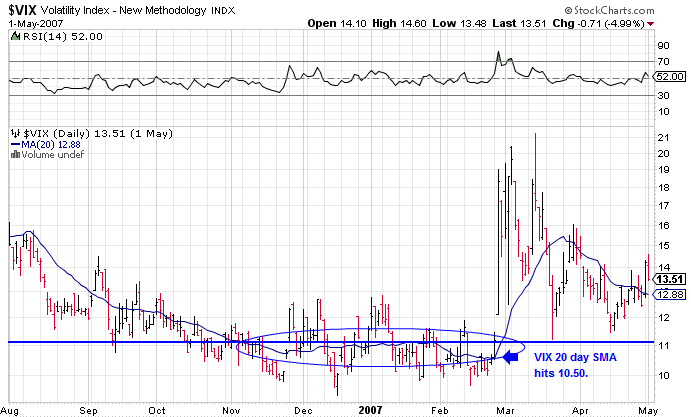
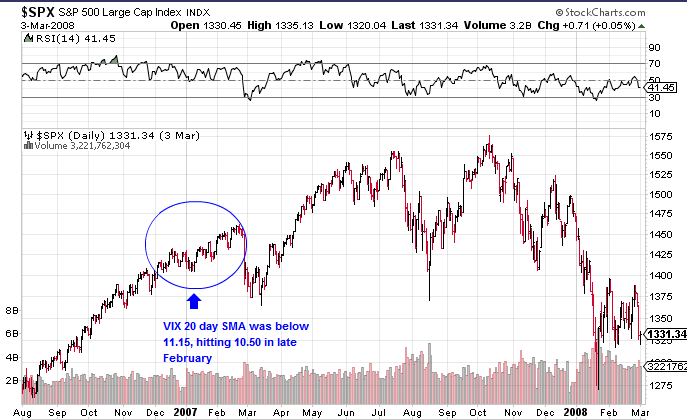
In 2007, the VIX crossed below 11.15 again, and stayed there for a while:
In late 2006 and early 2007, the VIX 20-day SMA dipped below 11.15, and stayed there for over three months. It hit a low of 10.50 in late-February 2007. Here is how the market traded after that:
This period marked a short-term top, but the market plowed higher for another 8 months, before the 57% decrease peak-to-trough in October. In this 8-month period, the VIX continued to creep higher, moving from the 11.15 area to around 17.50 in October 2007, before the ultimate market downturn.
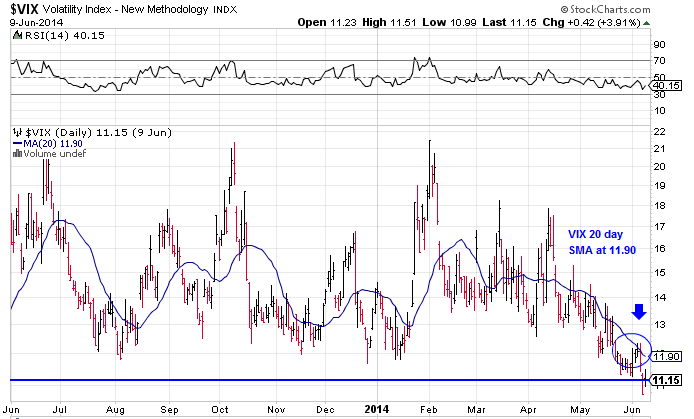
So what do we see now?
The VIX 20-day SMA is now at 11.90, while the current daily VIX is 11.15. If history is our guide, we still have some time for the fear to continue to subside. And over the past three months, the VIX is rapidly decreasing as the market is continuing to melt up.
So what does the VIX tell us?
1) The monthly 21-year period has shown the VIX hit 11.15 five times. Today is one of them.
2) Excluding the current one, in three of the four time frames, the VIX 20-day SMA has dipped below 11.15.
3) In each those three (1994, 2005/2006, and 2007), the market did sell off, although only the 2007 market was a devastating blow.
4) In only two of those time frames did it drop below 11.0, and those were 1994 and 2007.
The VIX does clue us into the state of mind of individual and institutional investors, and using Warren Buffett’s rule about fear and greed, it does help identify those points.
We would continue to monitor the VIX and use it as one of many indicators about the state of the market. We’re not in the danger zone yet, but getting closer. A dip below 11.15 (SMA) is a big warning, and a dip below 11.0 spells trouble coming.
Source:
What Does The VIX Now Say About The Stock Market?
Disclosure: The author has no positions in any stocks mentioned, and no plans to initiate any positions within the next 72 hours. The author wrote this article themselves, and it expresses their own opinions. The author is not receiving compensation for it (other than from Seeking Alpha). The author has no business relationship with any company whose stock is mentioned in this article. (More…)
Read more:
What Does The VIX Now Say About The Stock Market? | Seeking …
See which stocks are being affected by Social Media

