
Be Prepared For Stocks To Crash – Business Insider

MPI/Getty Images
The stock market continues to set new highs, which is exciting and fun for those of us who own stocks.
I own stocks, so I’m certainly enjoying it.
I hope stocks continue to charge higher, but I can’t find much data to suggest that they will. I only have a vague hope that the Fed will continue to pump air into the balloon and corporations will continue to find ways to cut more costs and grow their already record-high earnings.
Meanwhile, every valid valuation measure I look at suggests that stocks are at least 40% overvalued and, therefore, are likely to produce lousy returns over the next 10 years.
Which valuation measures suggest the stock market is very overvalued?
These, among others:
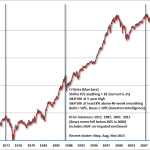
Cyclically adjusted price-earnings ratio (current P/E is 25X vs. 15X average)
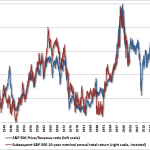
Market cap to revenue (current ratio of 1.6 vs. 1.0 average)
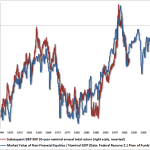
Market cap to GDP (double the pre-1990s norm)
How lousy do these measures suggest stock returns will be over the next decade?
About 2.5% per year for the S&P 500 — a far cry from the double-digit returns of the past 5 years and the ~10% long-term average.
If stocks just park here for a decade and return 2.5% a year through dividends, that wouldn’t be particularly traumatic. But stocks rarely “park.” They usually boom and bust. So the farther we get away from average valuations, the more the potential for a bust increases.
So the higher we go, the less surprised I will be to see the stock market crash.
How big a crash could we get?
According to the aforementioned valuation measures, and the work of fund manager John Hussman of the Hussman Funds, 40%-55%.
A 50% crash would take the S&P 500 below 900 and the DOW below 8,000.
Is that going to happen?
No one knows.
And, just as importantly, no one knows when. (Valuation is unfortunately not helpful in predicting short- or intermediate-term market moves.)
But a careful study of history suggests that a crash is increasingly likely and that long-term stock returns from this level are likely to be crappy.
I’ve explained in detail here why I think the odds of a crash are increasing. And I’ve also explained why, despite this, I’m not selling my stocks. (In short, because I am a long-term investor, I am mentally prepared for a crash, and I am planning to ride out any crash, the same way I did with the 2008-2009 crash. And also because there isn’t anything else compelling to invest in.).
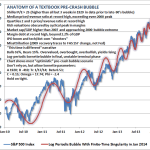
Here’s a chart from Mr. Hussman that lists many of the reasons why he (and I) are bracing for a crash. And, below that chart is an excerpt from Mr. Hussman’s latest note, in which he explains the valuation concern in more detail.
And here’s the excerpt:
Stock Valuations – an unrecognized bubble
Recently, as part of his book promotion tour, Alan Greenspan has hit the media circuit. His remarks include the assertion that stocks are still attractively valued, based on his estimate of the “equity risk premium.” See Investment, Speculation, Valuation, and Tinker Bell for a full discussion of the Fed Model, “equity risk premium” calculations, and a variety of far more reliable valuation methods that are tightly associated with subsequent S&P 500 total returns.
The simple fact is that on metrics that have been reliable throughout history, and even over the past decade, stock market valuations are obscene. Importantly, these same valuation metrics were quite optimistic about prospective market returns at the 2009 low.
As a side-note, one should not confuse the message with the messenger here. It’s no secret that my insistence on stress-testing our return/risk estimation methods against Depression-era data resulted in missed returns in the interim (2009-early 2010), but none of that reflects our valuation metrics, which indicated prospective 10-year S&P 500 total returns in excess of 10% annually at the time. The real concern in 2009 was that even after similar valuations were observed during the Depression, the stock market still went on to lose two-thirds of its value. So I’m quite open to criticism about my insistence on stress-testing (which I still believe was a fiduciary obligation given the events at the time). But one should be careful in concluding that this removes the ominous implications of present valuations.
On the basis of a wide variety of historically reliable fundamentals, we currently estimate 10-year S&P 500 nominal total returns of just 2.5% annually. Notably, the Shiller P/E (S&P 500 divided by the 10-year average of inflation-adjusted earnings) is now at 25. Prior to the late-1990’s bubble, the only time the Shiller P/E was higher was during three weeks in 1929 that accompanied the extreme peak of the market before stocks crashed. Meanwhile, the price/revenue ratio of the S&P 500 is presently 1.6 – a level that is double its pre-bubble norm, and even further above levels historically associated with bear market lows.
We observe similar extremes in other reliable measures that aren’t dominated by cyclical movements in profit margins. The apparently “reasonable” market valuations based on margin-sensitive fundamentals (e.g. forward operating earnings) implicitly assume that all of history can now be ignored: profit margins will no longer be highly cyclical; margins will no longer vary as the mirror image of deficits in combined household and government savings (see Taking Distortion at Face Value); and they will instead permanently remain more than 70% above their historical norm.
Aside from the fact that we can fully explain the present surplus of corporate profits as the mirror image of deficits in the household and government sectors, the other reason to focus on normalized earnings, cyclically-adjusted earnings, revenues, and other “smooth” fundamentals is simple: they are strikingly accurate guides across history. Another such measure is the ratio of stock market capitalization to nominal GDP, based on Federal Reserve Z.1 Flow of Funds data. Again, the present multiple is about double the historical pre-bubble norm.
While the valuation of the S&P 500 Index itself was higher in 2000, it’s notable that the overvaluation of the S&P 500 was skewed in 2000 by extreme overvaluation in very large-capitalization stocks, while smaller capitalization stocks were much more reasonably valued. In contrast, we have never in history observed the median stock as overvalued as we observe presently. Indeed, the median price/revenue ratio of stocks in the S&P 500 now exceeds the 2000 peak. Likewise, as Damien Cleusix has observed, if we examine valuations by quartiles (25% of stocks in each bin), the average price/revenue ratio of the two middle quartiles also exceeds the 2000 extreme.
For the sake of completeness, I should also note that virtually every “overvalued, overbought, overbullish” syndrome we define is on red alert. I hesitate a bit on this point, because in contrast to nearly a century of market history where these syndromes were reliably associated with deep losses, the emergence of these syndromes since late-2011 has repeatedly been followed by yet further speculation (see the chart in The Road to Easy Street). My impression remains that this is not a permanent change in market dynamics, but simply reflects an anvil that has not yet dropped. So these syndromes have admittedly done us no favors in the more recent period. Still, it remains our job, and our discipline, to view market action within its full historical context.
Among the many largely equivalent ways to define an overvalued, overbought, overbullish syndrome, the blue bars on the following chart present one of the many we observe at present: Shiller P/E anywhere above 18 (overvalued), S&P 500 at a 5-year high and at least 8% over its 40-week smoothing (overbought), with bullish sentiment greater than 50% and bearish sentiment less than 20% based on Investors Intelligence figures (overbullish). Notice that we did not observe this particular variant in 2000 because bearish sentiment never fell below 20% in that year. Also, while sentiment data was not available in 1929, we can impute sentiment reasonably on the basis of past price movements. Using imputed sentiment, we can also include 1929 in the set of instances here.
Notice that we’ve observed three instances this year – in May, in August, and today. Given the lack of follow-through from recent syndromes, we have to at least allow for the possibility of a further blowoff, as the seduction of quantitative easing has encouraged investors to ignore these conditions. On the economy, the best we can say is that while some widely-followed Fed surveys and Purchasing Managers indices have improved modestly in recent months, the most recent rolling correlation between these measures and actual economic outcomes (employment growth, industrial production) has become even more negative at the same time (see When Economic Data is Worse than Useless). Again, my impression is that this is not a permanent change in economic dynamics, but a temporary effect of distortions from quantitative easing, but it does force us take a more agnostic view of the economy than we might otherwise have.
In any event, I continue to believe that it is plausible to expect the S&P 500 to lose 40-55% of its value over the completion of the present cycle, and suspect that whatever further gains the market enjoys from this point will be surrendered in the first few complacent weeks following the market’s peak. That’s how it works. If all of this seems like hyperbole, please recall my similar concern at the 2007 peak (see Fair Value – 40% Off), and the negative 10-year return projections – even on best-case assumptions – that we correctly estimated for the S&P 500 in 2000. These numbers relate to the striking gap between present valuation levels and normal historical precedent, not to personal opinion.
None of our own challenges in this decidedly unfinished half-cycle relate to our consistent ability to correctly assess long-term investment prospects. We may yet see some amount of further short-term speculation, but already for the median stock, the long-term investment outlook has never been worse.
You can read the whole thing here >
SEE ALSO: I Think There’s A Decent Chance Of A Stock-Market Crash
Continued:
Be Prepared For Stocks To Crash – Business Insider
See which stocks are being affected by Social Media

