
Effects of Latency on Interactive Visual Analysis | Intel Science …

By Zhicheng Liu*and Jeffrey Heer, University of Washington
One acknowledged benefit of using visualizations to explore data is to support interactive analysis at the speed of thought: starting from a visual overview of the data, analysts can interactively drill down, filter and change encoding to examine the data from different perspectives.
When dealing with large volumes of data, the time taken for query processing, data transfer and visualization rendering can be long and lead to usability issues. Maintaining low interactive latency becomes an important challenge. While many research works on data management and visual analysis aim to reduce latency, it is not clear if and how interactive latency affects people’s behavior and the outcome of visual analysis. Do differences at the scale of milliseconds matter? Would latency affect data analysis strategies?
Previous work suggests that the effects of interactive latency vary according to the amount of delay and the problem domain. In puzzle solving, for example, a four-second delay forces people to manipulate puzzle tiles less and to plan more in the head. Google finds that half a second delay in generating result pages caused a 20% drop in traffic and the effects of the delay persisted for days even after the delay was removed. In computer games, however, researchers found that delays as high as several seconds had negligible effect on the outcomes of strategy games such as Warcraft III. This surprising result can be explained by the observation that tasks such as understanding game situation and conceiving strategy play a more important role in affecting the outcome of a game. These tasks take place at a larger time scale, and so are less sensitive to typical network latencies.
While many research works on data management and visual analysis aim to reduce latency, it is not clear if and how interactive latency affects people’s behavior and the outcome of visual analysis. Do differences at the scale of milliseconds matter? Would latency affect data analysis strategies?
Similar to puzzle solving and strategy games, visual analysis involves higher-level cognitive activities such as interpreting data and validating hypotheses. However, visual analysis is open-ended and usually has no clearly formulated goal state. The results from other domains may not be simply extrapolated in our case. We thus conducted an experiment to understand the effects of latency on visual analysis.
Experiment Setup
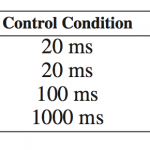
We adapt the open-source imMens system for our study. imMens is able to sustain a performance of 50 frames per second for interactive brushing & linking of 1 billion data points across 25 visualizations. We created two latency conditions: the control condition with no delay added (+0ms) and the delay condition with 500ms added for each interactive operation, as shown in Figure 1.
Figure 1: For the experiment, we created two latency conditions for various interactive visualization operations. (Source: Zhicheng Liu.)
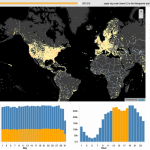
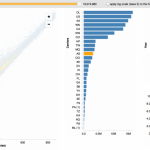
Each of the 16 participants performed two analysis sessions, one dataset each. One dataset contains 4.5 million mobile check-ins (Figure 2); the second dataset contains 140 million records about the on-time performance of domestic flights in the US from 1987 to 2008 (Figure 3). For each subject, one dataset had the default latency and the other dataset had the injected 500ms delay. To control for order and learning effects, half of the subjects experienced delay in the first session and the other half experienced delay in the second session. The order of the dataset analyzed was also counterbalanced. We asked subjects to report anything they found interesting, including salient patterns in the visualizations, their interpretations, and any hypotheses based on those patterns. Findings might include surprising events, data abnormality, or confirmations of common knowledge and intuition.
Figure 2: One dataset contains 4.5 million mobile check-ins. (Source: Zhicheng Liu.)
Figure 3: A second dataset contains 140 million records about the on-time performance of domestic flights in the US from 1987 to 2008. (Source: Zhicheng Liu)
Data Analysis and Results
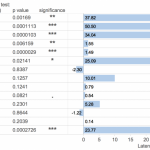
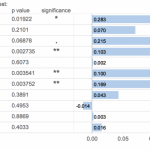
We collected two kinds of data: interaction logs about user behavior, and verbal data the participants reported. Figure 4 shows the results of log data analysis. The coefficients represent the changes in dependent variables as latency decreases from the delay condition to the control condition. We found a significant main effect for latency on triggered brush rate. Overall, users shift strategies in response to varying latency. The rates for brushing and range selection increase as latency decreases. This pattern is less obvious in navigational events such as zooming and panning. Under the delay condition, since processing each interaction will result in accumulated delay and serious usability problems, we implemented debouncing where imMens maintains a queue of events being fired, delays processing by 500ms, and drops unprocessed events when a new event of the same kind arrives. For processed events, we found significant main effects of latency for all data-related event types.
Figure 4: Results of log data analysis. (Source: Zhicheng Liu)
To analyze the verbal data collected, we first coded the data into seven categories: observation, generalization, hypothesis, question, recall, interface, and simulation (please refer to our research paper for details about these categories.) Figure 5 shows the results of verbal data analysis. In summary, lower latency encourages insight generation. We found significant main effects of interactive latency on observation rate, generalization rate and hypothesis rate. The coefficients represent the changes in dependent variables as latency decreases from the delay condition to the control condition (+0ms). Interestingly, the rate at which the participants ask questions is not affected by latency.
Figure 5: Results of verbal data analysis. (Source: Zhicheng Liu)
An unexpected result is that initial exposure to delay dampens later performance. Delays experienced in the first session affect subjects’ subsequent performance; even when the delay is removed in the second session, a negative impact on user performance persists.
At the end of each study, we asked subjects if they noticed anything different about the system between the two sessions. While many participants clearly observed the difference in latency, 6 out of 16 subjects did not report a noticeable difference in terms of system responsiveness. Of these six subjects, half experienced delay in the first session and half analyzed the mobile check-in dataset first. One subject (P9) even remarked:
“One thing that jumps out at me then is the fact that both of these things (datasets) were equivalently responsive, despite the scale of the second [dataset] is like .. you said, one versus a hundred? But yeah in terms of responsiveness the two kind of feel the same.”
Implications for System Design
Our study confirms that an injected delay of half a second per operation adversely affects user performance in exploratory data analysis. To conclude that high latency is bad, however, would be an over-simplification. As the experiment results demonstrate, some operations, such as zooming, are less sensitive to delay than others. In optimizing system performance, we can take such observations into consideration. Traditionally, visualization system design often takes a modular approach: the visualization pipeline is divided into stages with dedicated components for data management, scene graph construction and rendering. Optimization efforts have largely centered around each of these pieces separately. For example, a number of efforts are concerned with speeding up data processing with little consideration of the corresponding user interface design.
Our study suggests the value of taking a user-centric approach to system optimization.
Our study suggests the value of taking a user-centric approach to system optimization. Instead of uniformly focusing on reducing latency for each of the processing stages in the visualization pipeline, a potential optimization strategy is to analyze the interaction space supported by the visual interface and balance computational resources between interactive operators. For example, more aggressive caching or prefetching methods may be employed for operations sensitive to small variations in latency, such as brushing and linking.
We will present our research paper, “The Effects of Interactive Latency on Exploratory Visual Analysis,” at InfoVis 2014, November 9-14, in Paris.
* Zhicheng Liu is a research scientist in the Creative Technologies Lab at Adobe Research. Before joining Adobe, he was a postdoctoral scholar at the Department of Computer Science of Stanford University, working with Jeffrey Heer. he completed his PhD in the Human-Centered Computing program at Georgia Tech in spring 2012, advised by John Stasko.
Link:
Effects of Latency on Interactive Visual Analysis | Intel Science …

