
SMToolbox: Bottlenose Social Analytics | Social Media Today
Social analytics has been in the news again with Twitter’s recent acquisition of Gnip. There appears to be a consensus that hidden within the mass of social data are insights that can provide companies with a competitive edge. However, drawing out these insights is not easy despite the range of social analytics tools that exist. This week in SMToolbox, I am looking at how you can develop insights with Bottlenose, which brings a refreshing and sophisticated approach to real time social analytics.
One of the things I liked when talking to Bottlenose was their aim to create ‘narratives from noise’. At one level Bottlenose is similar to other tools in that it aims to spot social trends, track interests, measure conversations, analyze keywords and identify influencers. However, this is where the similarities end. Bottlenose is ambitious and aims to map a global picture of interests/activity in real time so that you can see what the world is thinking about any topic. The tool combines data from many different sources not just social networks, incorporating advanced demographic data and sophisticated sentiment analysis to help you understand the root cause of global trends.
Streams and Volume Data
Bottlenose allows you to set up a number of streams. Effectively these are sophisticated searches that pull data from a specific source (i.e. Twitter) or multiple sources such as blogs, news sites and social networks.
In my view the ability to set up a sophisticated search or stream is absolutely key to the quality of the results you receive. In adiditon to selecting your sources Bottlenose allows you to include and exclude keywords, and further allows you to fine tune your stream for example by only including people with more than a specified number of followers.
Once you have your stream Bottlenose will provide you with a wide range of standard volume and comparison data which you can filter in many ways for example by interaction type or message type. The real value of Bottlenose is in the sophistication of its data tracking and its fresh visual analysis approach as set out below.
Bottlenose Sonar View
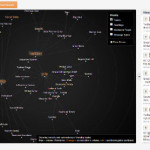
Bottlenose immediately looks different from other social monitoring tools when you open up the nerve center. You see a sonar style image which is a real time map of social activity for your stream. The tool provides a unique visual representation of a topic or stream to help you gain insights into the trends as they take shape.
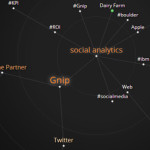
Below is the sonar view for social analytics when I was using the tool at the time of Twitter’s acquisition of Gnip. You can instantly see the hashtags and topics related to social analytics in the visual map below.
The orange text shows topics where activity is accelerating and the word’s size indicates the amount of activity. Thus we can see very quickly that Gnip was a key topic driving social analytics social activity. This was to be expected given the news of their acquisition by Twitter.
I was keen to explore a little further to see how Bottlenose could help me understand what the world was thinking about the acquisition. In Bottlenose almost everything is clickable. By selecting any topic on the sonar map you can instantly bring up in a side panel displaying relevant social content, as shown below. You can also click each post to get more detail such as number of retweets or to see a conversation’s entire thread.
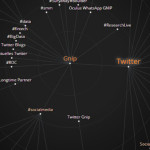
On the sonar view you can also dive down into any topic shown on the visual map. I decided to dive in and explore the social world of Gnip, which looked as follows.
You can instantly see that the term Twitter was driving the traffic around Gnip. However, Bottlenose also surfaced related topics and hashtags such as ‘Firehose Deal’ and ‘Datasift’, a Gnip competitor. This provided me with other areas to explore.
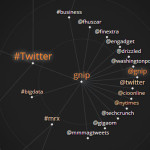
In Bottlenose’s sonar view you can also switch from topics and hashtags to mentioned users or to content type. I added mentioned users to the sonar which bought up the screen below.
The Gnip activity was primarily driven, not surprisingly, by the Twitter hashtag and @gnip. However, I could also see that the @nytimes was a rising mentioned user and wanted to check out the related tweets. I pulled up these tweets which included links to the New York Times article about the acquisition and their perspective on the acquisition.
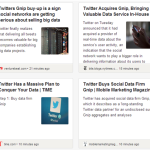
You can view related articles quickly by creating a trending newspaper screen in Bottlenose, you can see below the trending newspaper it created for me on the Gnip acquisition.
This is just one example of how Bottlenose maps data from many different sources. They claim to cover 98% of all US, UK, Canada & Middle East broadcast data, so global news sites are included as well as social data and blogs.
Detailed Demographic and Sentiment Data
Bottlenose have purchased detailed demographic data which allows them to filter by income, geography and interests, including brands that people like. Thus you can filter down to people in Texas earning over $75,000 that like a particular brand and view their sentiment towards your brand or a particular topic.
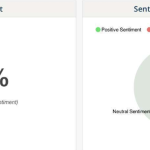
The sentiment analysis provides an overview of sentiment for your stream as follows.
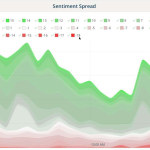
These type of charts are fairly standard. However, Bottlenose goes further by leveraging their own algorithms alongside Lexalytics to support advanced sentiment analysis. These allow you to review and filter by emotion types rather than simply positive or negative sentiment. Below is an example screen showing sentiment spread over a specified period.
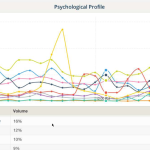
Bottlenose will also provide you with a psychological profile of activity showing the trends for different emotion types.
As you can see this view categorizes social mentions into different emotional types such as aggression or affection. Negativity travels fast in the world of social media so you want to surface emotions in real time and address these as appropriate.
Social Influence
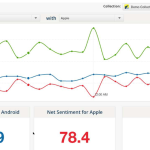
Bottlenose use the SIM score to help your understanding of social influence. SIM is a social influence ranking score developed originally by Razorfish. This assesses sentiment for your brand against the average sentiment in your industry. Below are comparison SIM scores over time for Android and Apple.
Hopefully through these brief examples you can see how Bottlenose helps you to make sense of social activity and move from volume data to insights.
Summary
Bottlenose is an advanced real time social intelligence platform, which enables you to find out about trends quickly and to explore what is driving these trends backed by detailed sentiment analysis. In essence it helps you address the who, what, when and why questions.
The platform is used by major brands and is available on an annual contract. Prices are based on the number of mentions tracked, which start at up to 1m mentions a month. The team are very hands on in my experience and very determined to make sure that you get the most out of the platform. If you want to explore Bottlenose further a full demo is available.
Column logo by Marie Otsuka
Originally posted here:
SMToolbox: Bottlenose Social Analytics | Social Media Today

