
Stock Market Bubble: Time To Get Out Of Stocks? | ETF DAILY NEWS

Are we at the tail end of the stock market bubble to end all stock market bubbles? Wall Street was full of glee Monday when the Nasdaq closed above 5000 for the first time since the peak of the dotcom bubble in March 2000. And almost everyone in the financial world seems convinced that things are somehow “different” this time around. Even though by almost every objective measure stocks are wildly overpriced right now, and even though there are a whole host of signs that economic trouble is on the horizon, the overwhelming consensus is that this bull market is just going to keep charging ahead. But of course that is what they thought just before the last two stock market crashes in 2001 and 2008 as well. No matter how many times history repeats, we never seem to learn from it.
Back in October 2002, the Nasdaq hit a post-dotcom bubble low of 1108. From there, it went on an impressive run. In late 2007, it briefly moved above 2800 before losing more than half of its value during the stock market crash of 2008.
So the fact that the Nasdaq has now closed above 5000 is a really big deal. The following is how USA Today described what happened on Monday…
Have you ever wondered how billionaires continue to get RICHER, while the rest of the world is struggling?
“I study billionaires for a living. To be more specific, I study how these investors generate such huge and consistent profits in the stock markets — year-in and year-out.”
CLICK HERE to get your Free E-Book, “The Little Black Book Of Billionaires Secrets”
The Nasdaq Composite capped its long march back to 5000 Monday, eclipsing, then closing above the long-hallowed mark for the first time since March 2000.
The arduous climb came on the heels of a 10-day winning streak that ended last week, Nasdaq’s longest since July 2009. That helped fuel the technology-heavy market index to a 7% gain in February, the sixth-largest monthly climb since its 1971 launch.
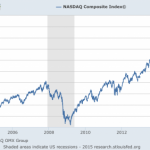
The chart below shows how the Nasdaq has performed over the past decade. As you can see, we are coming dangerously close to doubling the peak that was hit just before the last stock market collapse…
By looking at that chart, you would be tempted to think that the overall U.S. economy must be doing great.
But of course that is not the case at all.
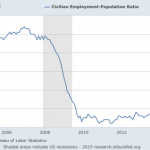
For example, just take a look at what has happened to the employment-population ratio over the past decade. The percentage of the working age U.S. population that is currently employed is actually far lower than it used to be…
So why is the stock market doing so well if the overall economy is not?
Well, the truth is that stocks have become completely divorced from economic reality at this point. Wall Street has been transformed into a giant casino, and trading stocks has been transformed into a high stakes poker game.
And one of the ways that we can tell that a stock market bubble has formed is when people start borrowing massive amounts of money to invest in stocks. As you can see from the commentary and chart from Doug Short below, margin debt is peaking again just like it did just prior to the last two stock market crashes…
Unfortunately, the NYSE margin debt data is a month old when it is published. Real (inflation-adjusted) debt hit its all-time high in February 2014, after which it margin declined sharply for two months, but by June it had risen to a level about two percent below its high and then oscillated in a relatively narrow range. The latest data point for January is four percent off its real high eleven month ago.
So why can’t more people see this?
We are in the midst of a monumental stock market bubble and most on Wall Street seem willingly blind to it.
Excerpt from:
Stock Market Bubble: Time To Get Out Of Stocks? | ETF DAILY NEWS

