firstadopter.com » Candlestick Pattern Signals–Technical Analysis
Home
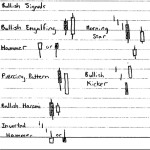
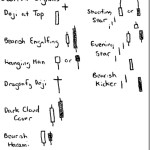
> Articles > Candlestick Pattern Signals – Technical Analysis Candlestick Pattern Signals – Technical AnalysisJune 30th, 2014firstadopterCandlestick pattern signals give you a representation of supply/demand for a security on a daily basis. Forgive my crude art-work, here are the basic signals:Categories: Articles
Originally from:
firstadopter.com » Candlestick Pattern Signals–Technical Analysis
See which stocks are being affected by Social Media
[…]