reading

TraderFeed: A Different Way of Tracking Stock Market Strength With …

TraderFeed: A Different Way of Tracking Stock Market Strength With Technical Indicators

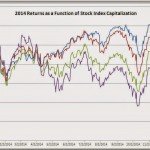
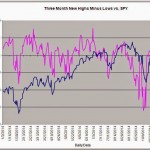
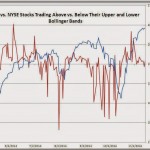
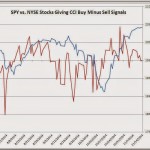
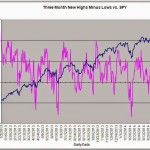
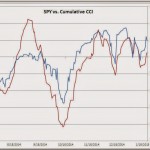
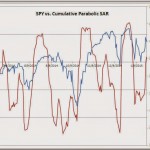
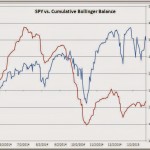
A Different Way of Tracking Stock Market Strength With Technical IndicatorsSuppose we think of technical indicators as measures of strength and weakness, with each giving buy and sell signals based upon different time frames and definitions of strength. One way to assess the overall strength of the stock market […]

TraderFeed: The U.S. Stock Market Story for 2014: Bigger Has Been …

Quick question: Has 2014 been an up year or a down year for U.S. stocks?Chances are good that, if you anchor your view of the market to the Standard and Poors 500 Index or the Dow Industrials, you’d answer correctly that it’s been an up year. Less well appreciated is that the smallest capitalization stocks (IWC) are actually a bit […]

TraderFeed: A Quick Update on Stock Market Strength

TraderFeed: A Quick Update on Stock Market Strength

A Quick Update on Stock Market StrengthMy recent post suggested that we were seeing diminished strength in the U.S. stock market, but not distinct signs of weakness. Above we see three charts that update the view on market strength.The top chart tracks the number of common stocks across all exchanges that have made […]

What are the Factors That Drive Short Term Returns in the Stock …

What are the factors that drive short-term returns in the stock market?It’s an important question for short-term traders obviously, but also for longer-term market participants, as the execution of one’s positions ultimately has a significant role in determining profitability. This is especially true in situations where longer-term participants face a mandate to keep losses at a minimum. The demands of […]

TraderFeed: Measuring Buying and Selling Power in the Stock Market

Recent posts have focused on improved versions of standard market indicators, including sentiment, Bollinger Bands, VWAP, and ticks. One of my most challenging projects, however, has focused on the creation of measures of buying and selling pressure in the stock market. My goal in creating this measure was to follow an intuition and treat supply and demand as separate, independent […]

Farm Data Means Big Bucks for Big Data Firms · Environmental …

June 24, 2014Farm Data Means Big Bucks for Big Data FirmsBig Data companies such as Deere & Co and Monsanto’s Climate Corporation, which have partnered with farmers, retain ultimate control over growers’ field data they collect that could be worth billions — and that doesn’t sit well with farmers, Reuters reports.The companies’ tools help with precision planting, improved fuel efficiency, […]

TraderFeed: Making Technical Analysis Dynamic

A while ago, I posted on the topic of divergences appearing in the U.S. stock market. Specifically, we were near all-time highs in the large cap averages, but a significant number of stocks were making new lows and small caps in particular were dramatically underperforming. When I examined past instances of such underperformance, I found very different results […]

ZEW German Sentiment – Business Insider

German economic sentiment — as measured by the monthly ZEW survey — has tanked.The reading of 33.1 is 10 below the previous month’s reading, and well below expectations.ZEWOne possibility here is that the crisis in Ukraine is starting to have economic ramifications, especially in the Eastern part of the country. That statement, however, isn’t expressed explicitly in the report.The outlook […]

TraderFeed: What Stock Market Breadth is Telling Us

If you look closely, you’ll see something quite unusual: the large cap indexes, such as the Dow and SPX, have been making or have been close to making all-time highs. If we look at the broad universe of common stocks, however, we can see that more are making 3-month new lows than new highs. Indeed, this has […]

TraderFeed: A Look at Stock Market Money Flows

Punch up a chart of SPY and you’ll see that, even with yesterday’s drop, we’re not far off the market highs and above the level at which we finished 2013. (My flow index for the chart starts 2013 at a level of 100).If, however, we look at the money flows in SPY–the product of the share price times the […]