
Why The Stock Market Is Still Cheap | Seeking Alpha
People think U.S. stocks are expensive…
Yes, they have gone up a lot… But according to our favorite measure of stock market value, stocks are NOT expensive.
It’s a simple indicator, but it encompasses the important stuff. And right now, it’s telling us you could make double-digit profits in stocks over the next 12 months…
When our in-house stock market value indicator is below 22, you make double-digit profits in stocks over the next 12 months.
And when it is above 22, you lose money in stocks over the next 12 months.
Specifically:
When the Indicator Is:
Return One Year Later
Below 22
12.3%
Above 22
-0.2%
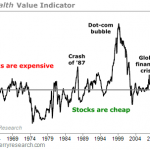
The chart below shows our value indicator at work. You can see just how extreme the peak in stocks was in 2000… and just how extreme the bust was in 2009. Importantly, you can see that we are nowhere near the “expensive” line today. Take a look…
There are two inputs to our stock market value indicator… 1) company earnings, and 2) the economic situation.
For company earnings… we use a price-to-earnings (P/E) ratio for the market. The P/E ratio is the classic measure of value for a business. But there are brief periods where it can be an imperfect and incomplete measure of value. Our in-house indicator addresses those two things.
The P/E ratio can be imperfect as an indicator during recessions. It can jump dramatically – not because stock prices are high, but because the denominator – the “E” or earnings – goes low.
So we make a small correction to the P/E ratio when that happens. We come up with an “adjusted” P/E ratio for the market. This makes the stock market’s P/E ratio much less imperfect.
The P/E ratio also doesn’t fully take into account the economic situation. It’s not perfect for an apples-to-apples comparison of one economic situation versus another.
Sometimes the stock market has all kinds of economic headwinds – whether it’s high inflation, unemployment, or high interest rates. We saw all of these in the early 1980s.
Other times, stocks have an incredible economic tailwind – like in the early 2010s, when the Federal Reserve cut interest rates to zero with next to no inflation.
These are entirely different situations for stocks, but the classic P/E ratio doesn’t distinguish between them. Our value indicator accounts for these times by using the short-term interest rate.
Surprisingly, the short-term interest rate encompasses an incredible amount of information about the current state of the economy. For example:
•
The short-term interest rate will be high (likely higher than 10%) if inflation is high (say, 10%).
•
The short-term interest rate will be low (like it is as I write, near zero percent) if the Federal Reserve is trying to stimulate the economy.
For our measure of the economic situation, we use the interest rate on three-month government debts (also called the 90-day Treasury-bill rate).
In short, our in-house value indicator is:
The adjusted P/E ratio + the short-term interest rate.
I’m not claiming this measure of value is a perfect one… It just offers a clearer way of assessing the current situation.
The message today is simple: stocks aren’t as expensive as most people think!
Disclosure: None
Source:
Why The Stock Market Is Still Cheap
See the article here:
Why The Stock Market Is Still Cheap | Seeking Alpha
See which stocks are being affected by Social Media

