technical analysis

AUD/USD- Technical Analysis – FX-Insights

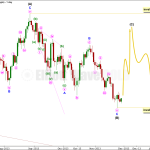
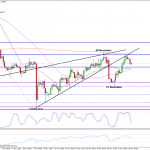
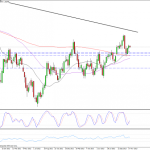
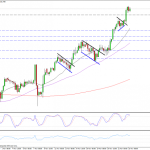
The AUD/USD pair has broken a major reversal pattern- Head & Shoulder on a daily time frame. The price is trading below the 50 day (shown in green) and 100 day (shown in yellow) moving average which means that the bears are in strong control of the price.  The pair has pierced the Bollinger band at this level which means that the […]

Investing.com: Technical Analysis 28 November 2013

Investing.com Technical Analysis (as of Thu, 28 November 2013 05:00pm EDT)by Investing.com Staff, Investing.comBelow, technical overviews and analysis for key stock indices, commodities and currency pairs, based on market activity at the close of the 28 November 2013 U.S. session. This information is a comprehensive summary derived from simple and exponential moving averages along with key technical indicators shown […]

28th November, 2013 – GOLD Elliott Wave Technical Analysis …

Yesterday’s analysis expected more upwards movement from Gold. Price has moved higher, but it is not a convincing third wave… yet.I have the same main wave count with now two alternates at the daily chart level. The first alternate may be used if confirmed with movement below 1,225.40. The second alternate expects the same movement as the main wave count.*Edit: […]

SILVER Elliott Wave Technical Analysis – 27th November, 2013 …

Last week’s analysis of Silver expected more downwards movement towards a target at 18.591 to 18.353. Price did move lower but has failed to reach the target. Downwards movement may have ended at 19.595, 1.004 short of the target zone.The wave count remains mostly the same.Click on the charts below to enlarge.Minor wave B is now a complete zigzag.Within minor […]

Elliott Wave India – Taking technical analysis to next level: Trading …

The below research is by Waves Strategy Advisors. For various research products visit http://wavesstrategy.com/index.php/store.html
The below article highlights on how to trade Gold using basic “Technical analysis” and techniques like Channels. Bullions are one of the highly liquid commodities.
In 2009 Comex Gold was almost trading near 650 per ounce and it made life time of 1900 near […]

Investing.com: Technical Analysis 26 November 2013

Investing.com Technical Analysis (as of Tue, 26 November 2013 05:00pm EDT)by Investing.com Staff, Investing.comBelow, technical overviews and analysis for key stock indices, commodities and currency pairs, based on market activity at the close of the 26 November 2013 U.S. session. This information is a comprehensive summary derived from simple and exponential moving averages along with key technical indicators shown […]

US OIL Elliott Wave Technical Analysis – 26th November, 2013 …

Last week’s US Oil analysis expected more downwards movement towards 89.83 for the end of a third wave. Price did not move lower. Instead, it has moved a little higher and sideways. The third wave was already over, and sideways and higher movement is the following fourth wave. Overall the wave count is not much changed on the daily chart. […]

Weekly Technical Analysis – “Dec Overshoot Target S&P500 1850 …

Here below the latest Swiss team’s technical weekly multi market comments and analysis.The price trend work remains intact as does sentiment and sectoral work with the finance sector finally joining the break out sectors.Europe, major index wise,  the Dax remains bullish (as does the ftse100) but the IBEX is theoretically the beta especially given the bias of the Swiss team […]

Daily Technical Analysis – 25 November 2013 | Alpari Newsroom …

Daily Technical Analysis – 25 November 2013November 25, 2013 by Craig Erlam in Technical analysisEURUSDThe euro is looking bearish again this week, having failed to break back above the ascending wedge. Even the weekly chart is looking a little bearish, with last week’s candle being a hanging man, signalling a trend reversal. It is worth noting that this is not […]